Bottom Line: Acoustic performance must be defined by numbers. With the right smartphone apps, you can achieve pro-level diagnostics for under $10 (or even free).
“It sounds quieter” is a subjective opinion, not a data point that can resolve neighbor disputes or validate a multi-thousand dollar investment. Visualizing your booth’s D-value (Transmission Loss) is the first step in professional-grade risk management.
This briefing covers the reliable apps used by engineers as Field Tools, along with the standardized measurement protocols to get accurate results.
1. Validated Sound Level Meter (SLM) Apps#
Smartphone hardware varies, so selecting apps with high-quality calibration profiles is critical.
① NIOSH Sound Level Meter (iOS Only)#
Developed by the National Institute for Occupational Safety and Health (NIOSH). Often cited as the most accurate software-only meter available.
- Features: Lab-grade precision. Includes Leq (Equivalent Continuous Sound Level) measurement.
- Use Case: Measuring the “Baseline” floor level outside your booth to detect leaks.
② Decibel X (iOS/Android)#
A feature-rich meter with excellent data logging and graphing capabilities.
- Features: Supports A-weighting and C-weighting filters.
- Use Case: Long-term monitoring of environmental noise in your studio area.
③ Sound Meter (Android)#
Specifically optimized to calibrate against the wide variance of Android microphone hardware.
2. Spectrum Analysis: Seeing the “Leak Frequency”#
Level (dB) tells you how loud it is; Frequency (Hz) tells you what is leaking.
RTA Audio Analyzer#
A Real-Time Analyzer (RTA) that visualizes the frequency distribution of your sound.
- Engineer’s Insight: If you see a peak at 500Hz outside your door, you know exactly which frequency your wall isn’t catching. This allows for surgical placement of absorption panels or specialized mass-loaded vinyl.
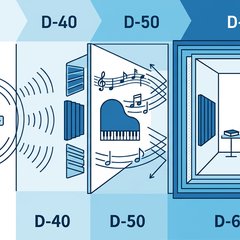
3. Practitioner’s Protocol: Calculating Your Own D-Value#
Follow these steps to generate a professional D-Rating for your booth or room:
- Source Initialization: Play “Pink Noise” through a speaker inside the room at a steady, loud level.
- Internal Baseline: Measure the dB level 1m from the speaker inside the room. (e.g., 95dB)
- External Sample: Walk outside, close the door, and measure at the same position outside. (e.g., 55dB)
- The Result: 95dB - 55dB = D-40 Performance.
Having a time-stamped log of this data is vital evidence if you ever face social friction regarding noise.
4. Hardware Caveats#
Smartphones are not designed to capture 110dB+ peaks or ultra-low frequencies below 30Hz with laboratory precision. For critical certification, consider a professional external mic like the “iTestMic” (Lightning/USB) which provides an analog-to-digital bypass for superior accuracy.
5. Summary: Turn Your Phone into a Diagnostic Tool#
- Use NIOSH SLM for your baseline dB numbers.
- Use RTA analysis to pinpoint spectral vulnerabilities.
- Log your data to track seal degradation over time.
By converting “feelings” into “data,” you upgrade your soundproofing from a guess to a verified engineering system.